Choosing the best social media marketing platform
Social media has grown to be the most visited platforms on the planet, they even outnumbered the mighty search engine Google.
So, who do not want to increase traffic to their website?
First, we need to understand that there are so many social media platforms to market on. Let us list the most common and most visited social media platforms.
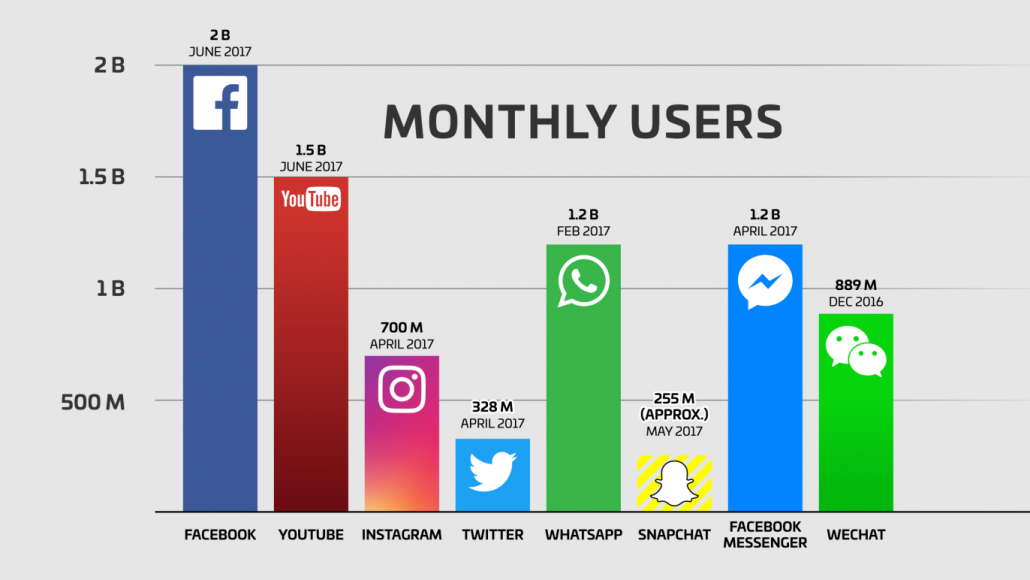
social media platforms stats 2017
As we can see from the figure above, Facebook is dominating the social media monthly active visitors. With over 2 billion active visitors monthly, YouTube with 1.5 billion active users. While Instagram have over 700 million monthly active users and Twitter with 328 Million monthly users.
There are a few social media platforms that did not feature in the figure above like Pinterest, LinkedIn, and Google+.
know your target audience
To be able to deliver your services, products and content to the right audience, you should consider your existing customer database. What are their ages and genders? What are their behaviors? Should I deliver the same message to all my customers? Or should I segregate them and deliver each segment with an appropriate tone and message.
Google analytics provides an excellent tool to find out who are your audience. So let us look at a sample Google analytics report to find out these main categories.
- Demographics
- Interests
- Geo
- Behavior
- Browser & OS
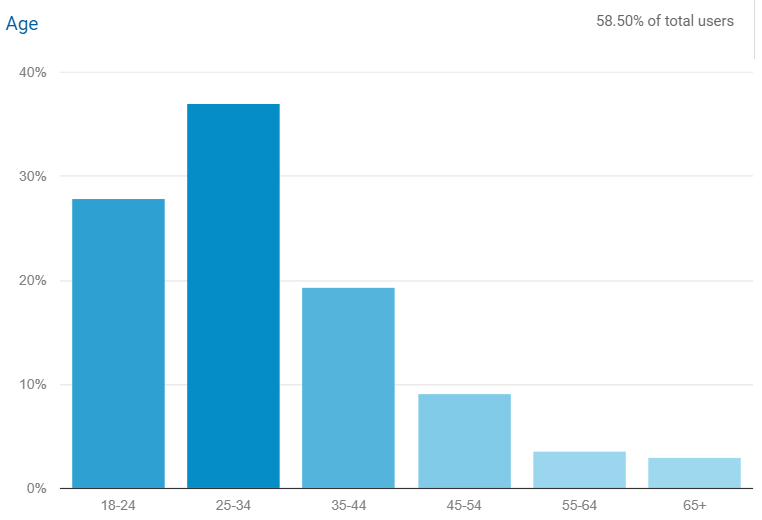
age statistics
As the figure above shows, most your traffic is between 25 and 34 years old, followed by 18 – 24 years old.
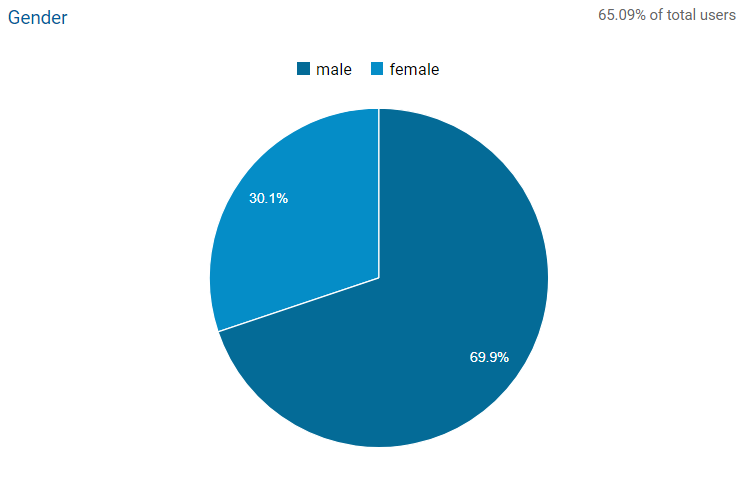
Gender statistics
As from the gender statistics graph shown, we can know that most our traffic are males with 69.9%.
I also created another customer report to show the age vs gender to determine what’s the gender in each age group.
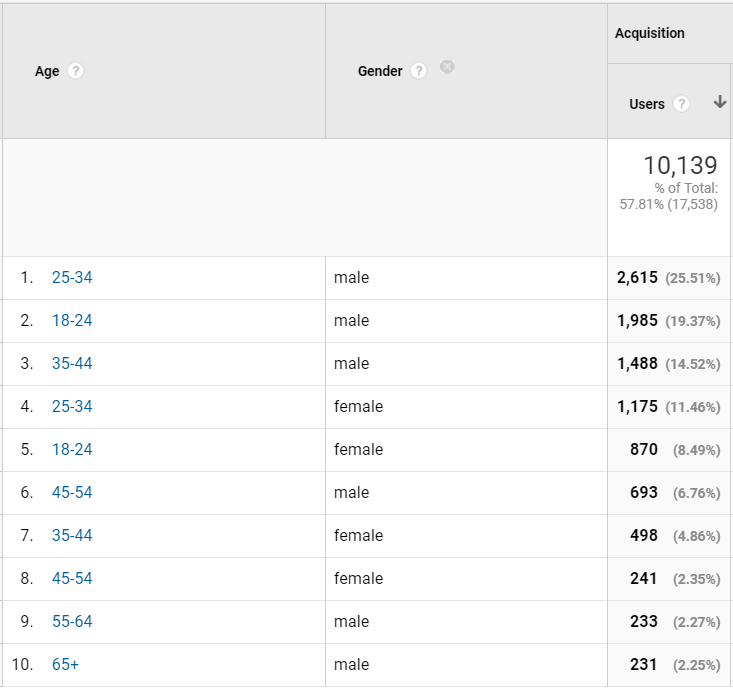
gender in each age group
The result is:
Most of our traffic are males between the age of 25 to 34, followed by males between 18 to 24. On the other hand, females between the age of 25 to 34 have 11.4% share from the whole traffic.
Google analytics can also provide an overview of the interests so the website owner has an overview of the traffic.
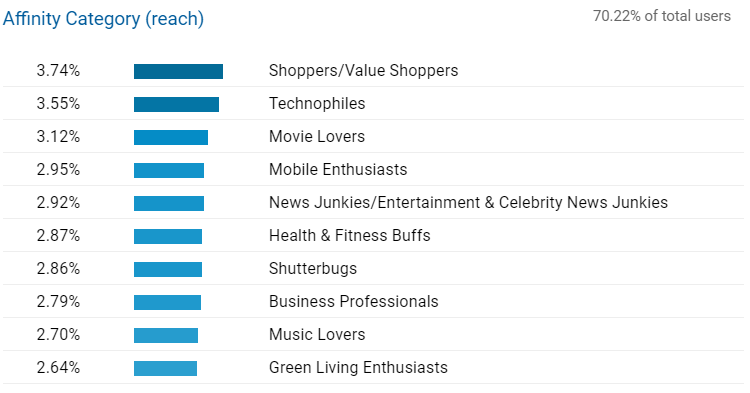
affinity category reach group
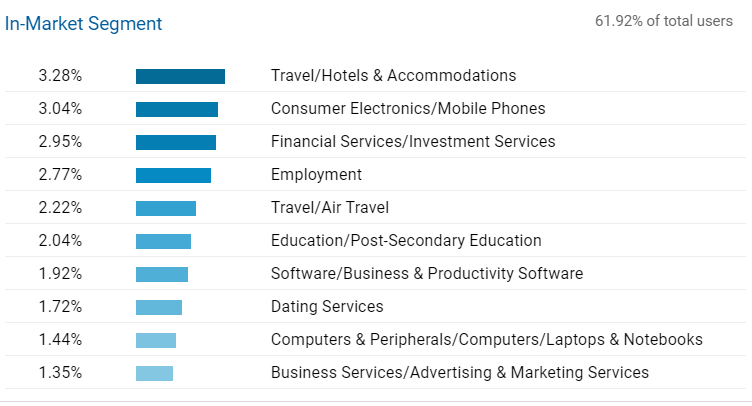
in market segment
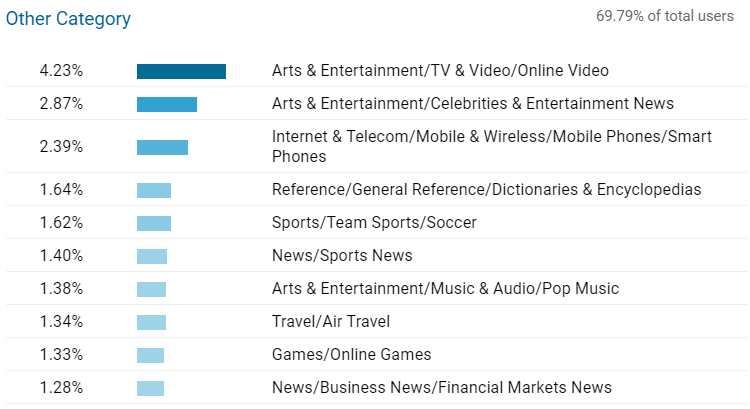
other category
From the figures above the website owner can understand what the interests of the website users are so the marketing campaign should focus on those interests as well.
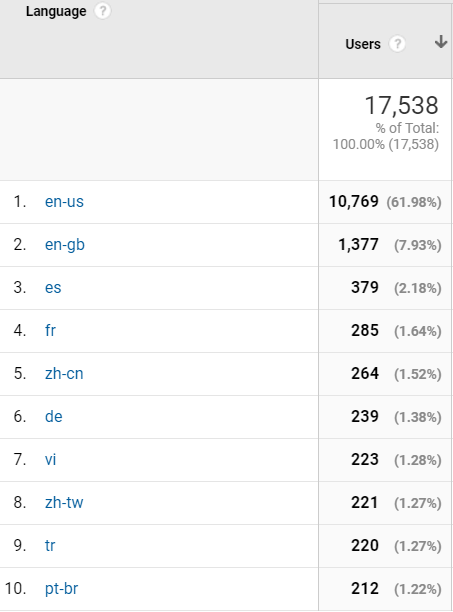
languages by users
The website owner can also find out the languages of the visitors. As we can see from the figure above, the most used language is English, with a few foreign languages such as Spanish and French.
So, around 12% of the visitors are using different languages than English. Should the site owner consider providing content in that language? Or it seems that they understand English fine and the website owner should not consider focusing on content in another language.
To answer this question, we should consider the bounce rate of non-English segment, also we compare the session time length between English and non-English segment.
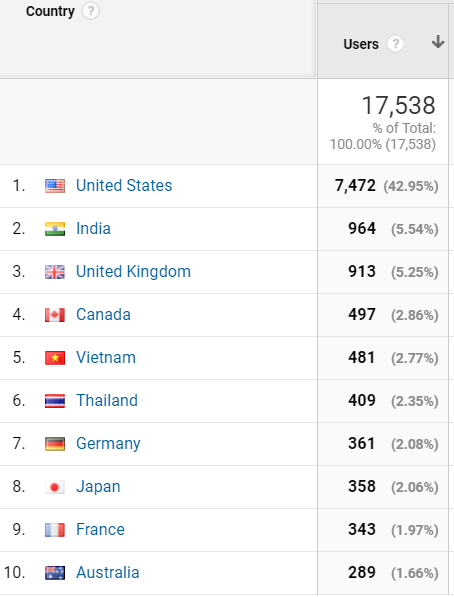
location by users
What are the services, products and content we want to market? Are we local business that operates locally? Or are we a worldwide service provider? Can we ship our product overseas? These are the type of questions that the marketer of a product, service and content should answer.
There is no benefit to target worldwide reach audience if the product, service or content cannot be delivered worldwide.
What kind of content you want to provide
there are 3 types of marketing content that you can provide in social media marketing platforms.
- Video
- Image
- Text
- And of course, a mixture between them
What is the best social media marketing platform to market video content on?
YouTube is the ultimate social media marketing platform for Videos, YouTube default max length is 15 Minutes.
Instagram (60 second video) and Facebook (up to 45 minutes) also can support video content.
What is the best social media marketing platform to market images content on?
Instagram is the best image sharing social media platform out there. Moreover, Facebook, Twitter, Google+ and LinkedIn can support image content
What is the best social media platform to market text content on?
Twitter is famous for publishing short message text and Twitter will be a suitable platform to publish short messages.
For more professional services, LinkedIn is the social media platform to market on with more than 500 million professional users. Moreover, more than 85% of Pinterest users are females, so it is a perfect platform to target females.
Conclusion
The best social media marketers are the ones that knows their audience, and know where are their target audience are. Also, they know their content and what social media will best present their content. Finally, the most successful ones are the ones who can mix and match these to deliver their content to their audience though the right channels.